Debugging CI/CD Failures: Root Causes
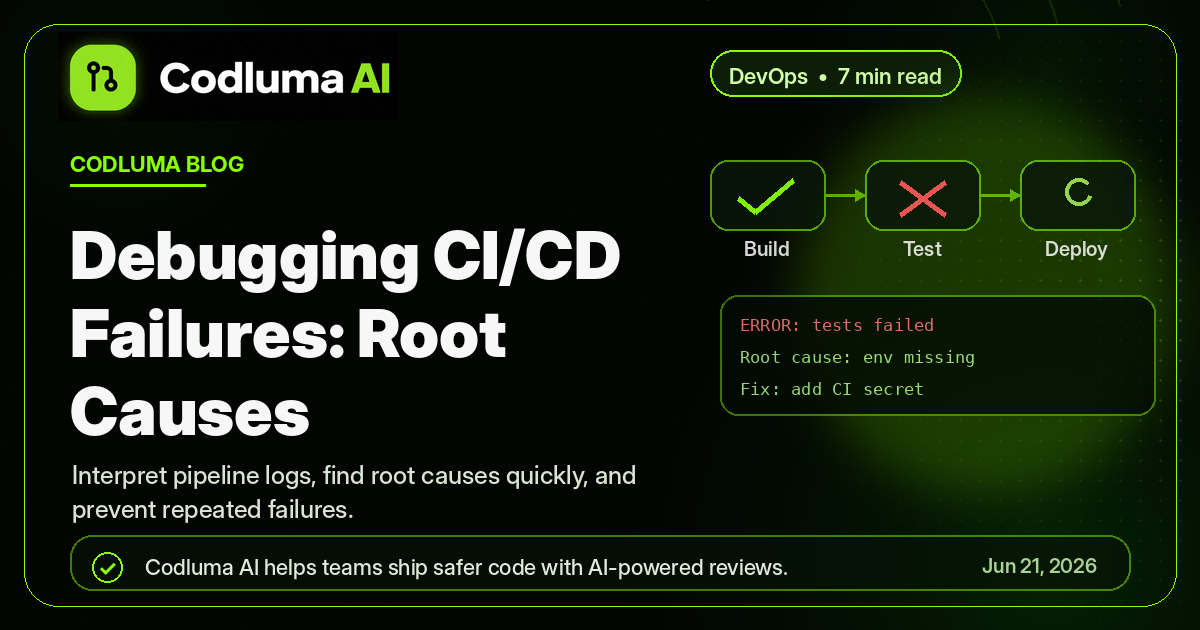
A practical guide to interpreting CI/CD pipeline logs, finding root causes quickly, and preventing repeated failures.
CI/CD pipeline failures are inevitable. Database migrations fail, deployments timeout, tests flake, integrations break. But the real problem is not the failure — it's the time wasted debugging.
A typical failed pipeline generates 500-5000 lines of logs. Finding the actual error among dependency output, warnings, and retries can take 20+ minutes. During that time, developers are blocked, features are delayed, and incident stress increases.
Why CI/CD Logs Are Hard to Debug
1. Volume: A failed deployment generates thousands of lines from multiple jobs, services, and dependencies.
2. Noise: Warnings, deprecation notices, and retries obscure the actual error.
3. Context: The error might appear 200 lines before the exit code, buried in output.
4. Specificity: Error messages from Docker, Kubernetes, npm, databases use different terminology.
Manual Debugging Process (the slow way)
1. Check final exit code (no, didn't help)
2. Read the last 100 lines (still noise)
3. Search for "ERROR", "FAIL", "Exception" (10 matches, same contextless error)
4. Trace backwards to understand the timeline
5. Check which job failed (oh, it's a different job than you thought)
6. Repeat for each upstream job
7. Finally: "Ah, the database migration script failed because of a lock"
Total time: 20-30 minutes
Automated Debugging (the fast way)
AI failure analysis reads the entire log, identifies the actual failure (database lock), shows the root cause (migration script holding lock), and suggests the fix (kill the lock, retry).
Total time: 30 seconds
This frees developers to focus on understanding the failure, not hunting for it.
Best Practices for Quick CI/CD Debugging
1. Structured Logging: Use JSON-formatted logs instead of plaintext. Easier to parse and search.
2. Semantic Versioning: Keep error codes and messages consistent across services.
3. Breadcrumbs: Log which job called which service, so you can trace requests.
4. Automatic Failure Summary: Post root-cause analysis to Slack or GitHub immediately.
5. Avoid Log Spam: Disable verbose logging in production. It makes signal detection harder.
About the Author
Marcus Williams
DevOps Engineer, Codluma
Marcus specializes in CI/CD infrastructure and observability. 15+ years building deployment pipelines at scale. Speaker at KubeCon and GitHub Universe.