Understanding Monorepo Dependency Graphs
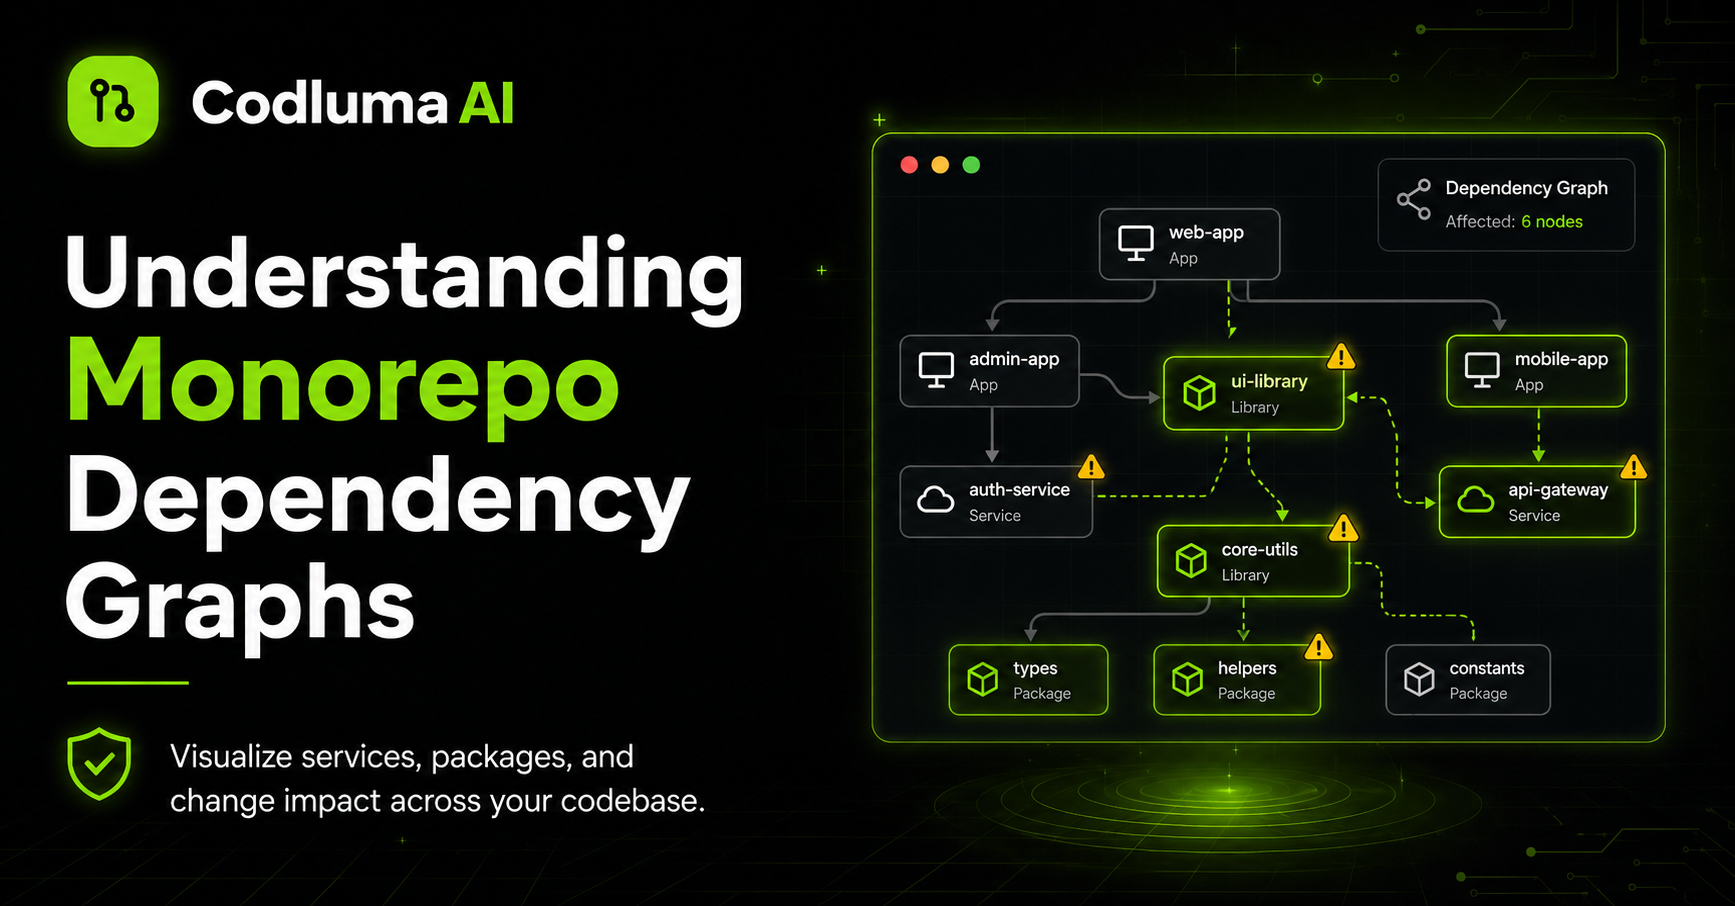
How to map which services are affected by a change. Learn dependency traversal, cross-workspace impacts, and blast radius scoring for monorepos.
Monorepos are powerful but risky: a change to a shared library can silently break dozens of services. Dependency graph analysis shows which services consume which libraries and calculates blast radius.
How Dependency Graphs Work
A dependency graph is a directed acyclic graph (DAG) of packages/services and their imports. If package A imports package B, then B is a dependency of A.
For a PR that changes B, the graph traces backward: "Which packages import B? Which packages import those? How deep does this go?"
Blast Radius Scoring
Blast radius is the count of affected services and a risk score (high/medium/low). A change to a leaf service affects only that service. A change to a core library affects everything that depends on it.
Codluma assigns risk: high if 50+ services affected, medium if 10-50, low if 1-10.
Limitations & Reality
Static analysis cannot catch dynamic imports (eval, reflection, feature flags). Some dependencies are "soft" (used for build-time only). Use blast radius as a guide, not gospel.
About the Author
Aisha Patel
Staff Engineer, Codluma
Aisha designed Codluma's dependency graph analysis. 10+ years managing monorepo infrastructure at scale. Published researcher in static analysis.